Creating WPForms charts is a great way to add visual interest to your data. In fact, WPForms can display charts directly on the entries screen.
Unfortunately, the WPForms built-in charts have many limitations:
- They work only for survey fields
- You can’t display them in your front end, so only users that can access the admin dashboard can see them
- You can’t add filters. So forget to do advanced stuff like showing only records of the previous month or charts that are specific for each user.
- Very limited customization. If you don’t like the way that WPForms displays the information you are out of luck as you won’t be able to change it.
BUT thanks to Page Builder for WPForms, you can easily display your survey results in the front end and in the exact way you want it.
Prerequisites
WPForms: You need to have the WPForm plugin installed on your site. The free version is fine but if you want to follow this tutorial step by step you will need the paid version to have access to the “Likert Scale” field.
Page Builder for WPForms: This plugin will let you display your WPForms entries on any page or post on your site. We will use it to create our charts.
Creating WPForms Charts
To display the survey results in the front end do the following:
1.- Create a form that has the fields that you want to use. You can create charts using several different fields but for this example, we are going to use the “Likert Scale” field.

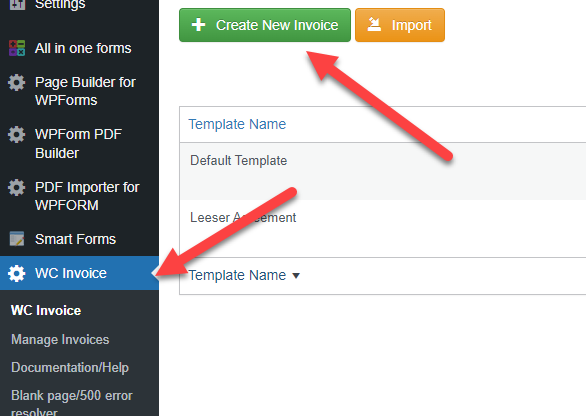
2.-Go to Page Builder for WPForms and create a new page template
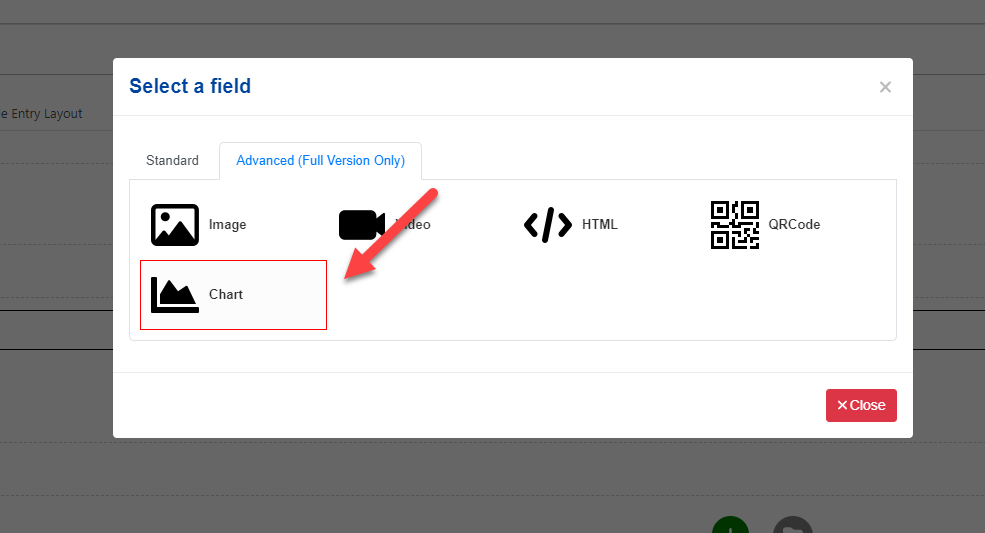
3.- Add a chart block in your template
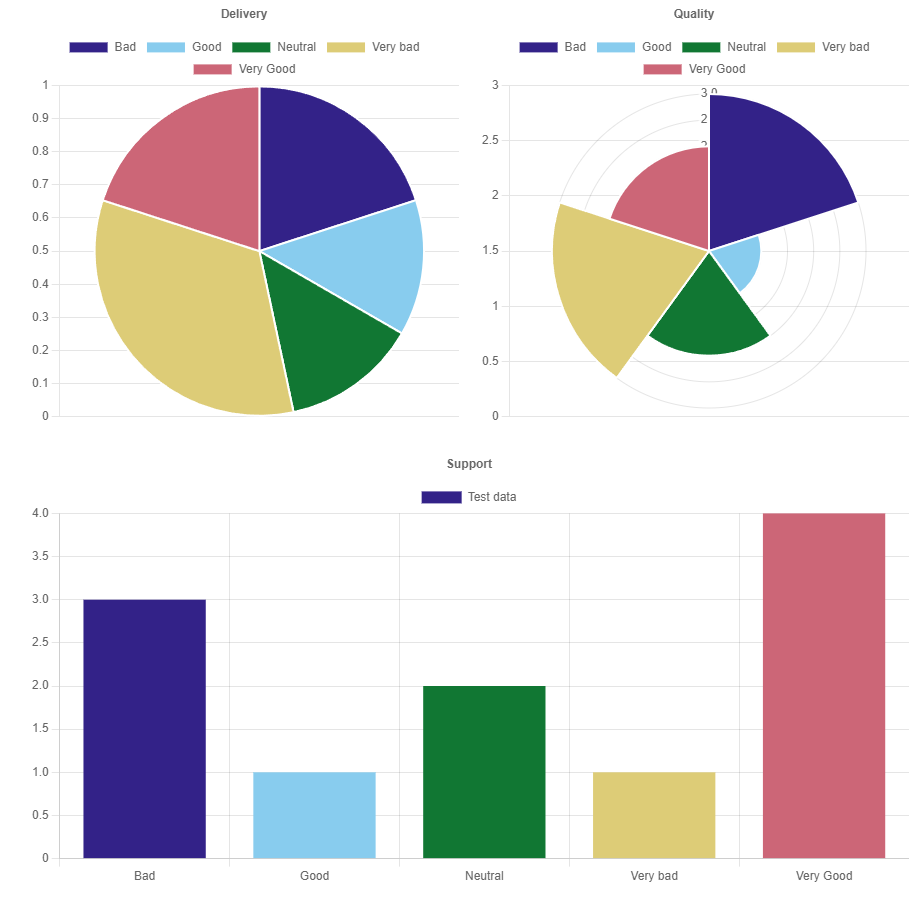
4.- Select the field that your chart should use. Since in my example I am using a Likert scale with multiple rows (Delivery, Quality, and Support) the chart block will also ask me which row I want to chart.
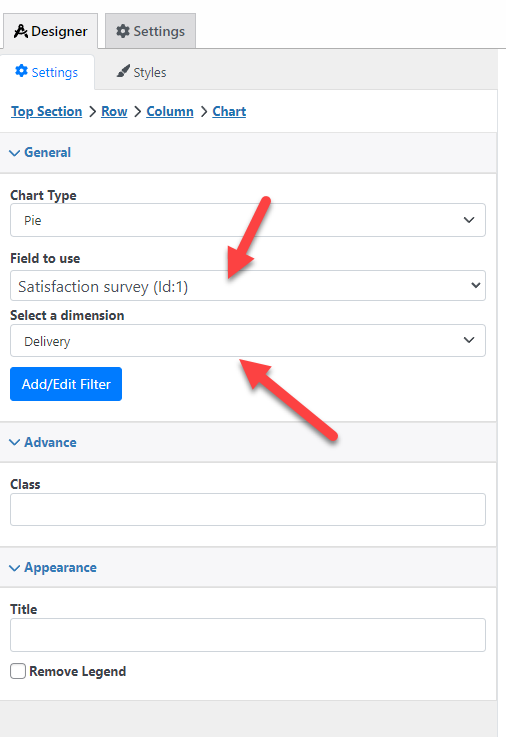
I can also filter the chart to include only specific entries (for example, all the entries of this month), to do so I just need to click on the Add/Edit Filter button (more about this in the next tutorial).
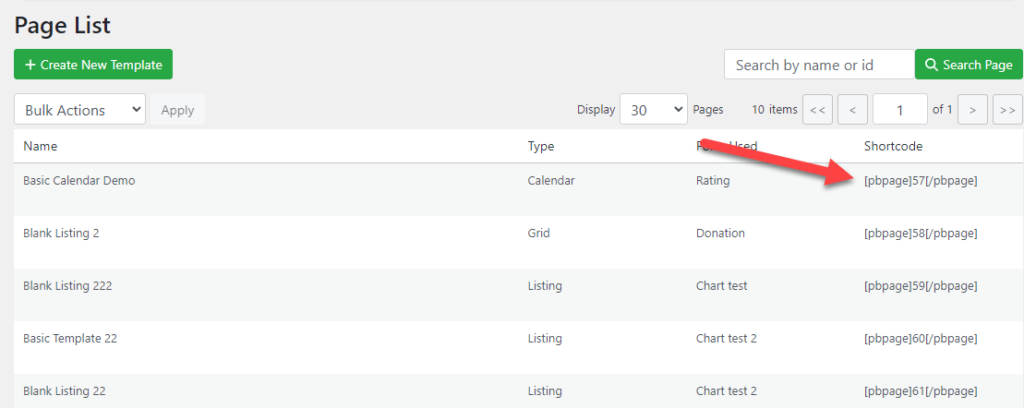
5.- Once you have your page template ready you just need to paste its shortcode into any page or blog. You can find the shortcode of your template on the “Page List” page.
And that’s it! now my page will also display my entries in a chart.
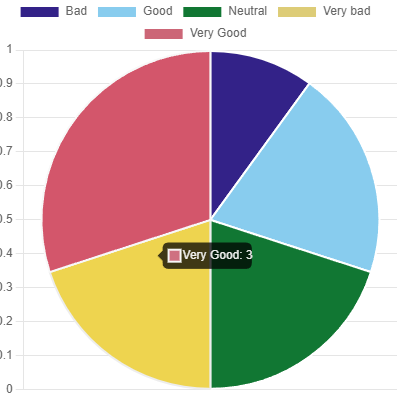
You can add as many charts as you want, in the example below I added a chart for each row (that is one chart for delivery, quality and support)
Adding dynamic filters to your WPForms charts
Now that you have your chart working you might also want to add some dynamic filters to it so the users can filter the charts as they want. For example to show only the records of a specific month or records that match one criterion.
To add dynamic filters do the following:
1.- Add a search bar to your page template

2.- Add the search criteria that you want to use. In the example below i want to filter my records by country.

3.- Go to your chart settings and click on the Add/Edit Filter.

4.- Add a Country filter and click on the “Map to” button to link it with our search bar. A panel will pop up.

5.-In the panel that is shown you will see two sections:
Field: List all the fields in your form
Search bar field: This section is only shown if you have a search bar in your template, it will list all the fields in your search bar.
Since I want to link the chart with my search bar (so for example if the user search by “Canada” my chart will also only show the records of Canada) I will select the “Country” field in the “Search bar field” section.

And that’s it! Now my chart will be filtered using my search bar. You can see see the live example here
Conclusion
You learned how easy is to create charts using your WPForms entries. In this tutorial, we used a “Likert Scale” field but the plugin is not limited to only that. You can create several different kinds of charts, for example, a chart that displays your top-selling products or one that display the best-reviewed products.
Also, you can create other types of pages, the plugin comes with a drag-and-drop builder so your imagination is the limit! To see some examples of the kind of pages you can create check our gallery